I <3 graylog and with graylog 3.0 almost GA, it promises to be even better. In this post (part of a multi-post series) I’ll walk you through setting up Graylog to ingest logs from Suricata.
First, let’s install graylog. While there are almost too many ways to deploy software these days, I’ve been playing with Juju lately, so that’s what I’ll use here to deploy graylog, mongodb, and elasticsearch into individual lxd containers. As we’ll be deploying to our local machine for demonstration purposes, I’ve already installed lxd (snap install lxd) and the juju client (snap install juju).
Let’s bootstrap our juju controller and deploy our charm bundle.
shaner@tp25:~$ juju bootstrap

Select a cloud [localhost]:

Enter a name for the Controller [localhost-localhost]: lxd

Creating Juju controller "lxd" on localhost/localhost
Looking for packaged Juju agent version 2.4.7 for amd64
To configure your system to better support LXD containers, please see: https://github.com/lxc/lxd/blob/master/doc/production-setup.md
Launching controller instance(s) on localhost/localhost...
 - Retrieving image: rootfs: 100% (394.82kB/s)s)
Installing Juju agent on bootstrap instance
Fetching Juju GUI 2.14.0
Waiting for address
Attempting to connect to 10.131.74.104:22
Connected to 10.131.74.104
Running machine configuration script...
Bootstrap agent now started
Contacting Juju controller at 10.131.74.104 to verify accessibility...
Bootstrap complete, "lxd" controller now available
Controller machines are in the "controller" model
Initial model "default" added
OK, our juju controller is bootstrapped and a default model has been added. Let’s proceed with deploying our software stack. Below is our charm bundle, copy into a file called graylog.yaml .
applications:
  graylog:
    charm: 'cs:graylog-23'
    num_units: 1
    series: bionic
    to:
      - '0'
  elasticsearch:
    charm: 'cs:elasticsearch-32'
    num_units: 1
    series: bionic
    to:
      - '1'
  mongodb:
    charm: 'cs:mongodb-51'
    num_units: 1
    series: bionic
    to:
      - '2'
relations:
  - - 'mongodb:database'
    - 'graylog:mongodb'
  - - 'elasticsearch:client'
    - 'graylog:elasticsearch'
machines:
  '0': {}
  '1': {}
  '2': {}
Now we can deploy it using juju.
shaner@tp25:~$ juju deploy graylog.yaml
Resolving charm: cs:elasticsearch-32
Resolving charm: cs:graylog-23
Resolving charm: cs:mongodb-51
Executing changes:
- upload charm cs:elasticsearch-32 for series bionic
- deploy application elasticsearch on bionic using cs:elasticsearch-32
- upload charm cs:graylog-23 for series bionic
- deploy application graylog on bionic using cs:graylog-23
  added resource graylog
- upload charm cs:mongodb-51 for series bionic
- deploy application mongodb on bionic using cs:mongodb-51
- add new machine 3 (bundle machine 0)
- add new machine 4 (bundle machine 1)
- add new machine 5 (bundle machine 2)
- add relation mongodb:database - graylog:mongodb
- add relation elasticsearch:client - graylog:elasticsearch
- add unit elasticsearch/1 to new machine 4
- add unit graylog/1 to new machine 3
- add unit mongodb/0 to new machine 5
Deploy of bundle completed.
shaner@tp25:~$
We can watch the status of the deployment using ‘watch -c juju status –color’. Here’s what that might look like:
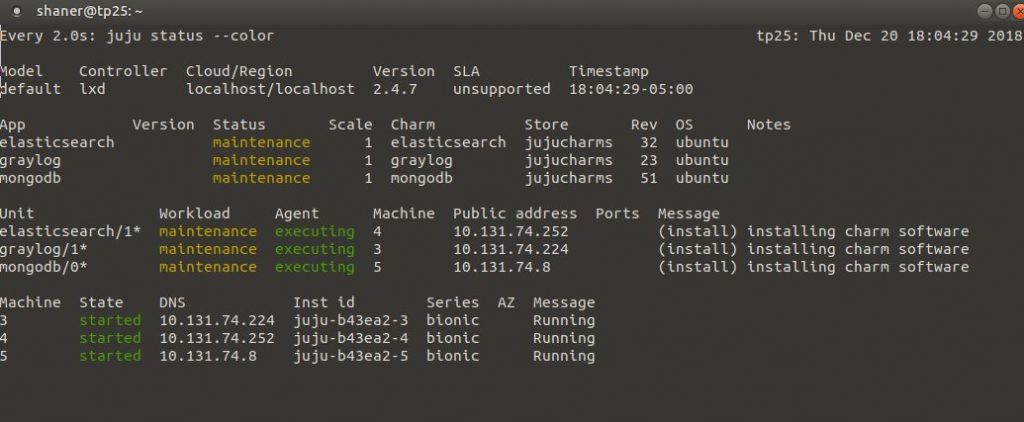
When complete, it’ll look something like this:

Now that graylog is up and running, we should be able to access the WebUI at the IP address show in the ‘juju status’ output. However, we need to get the admin password first. We’ll run the charm action below to get it:
shaner@tp25:~$ juju run-action --wait graylog/1 show-admin-password
unit-graylog-1:
  id: 188f2eda-2293-462d-8536-ded94afad957
  results:
    admin-password: zL9dkq3c6BMtrfqbyn
  status: completed
  timing:
    completed: 2018-12-21 03:58:05 +0000 UTC
    enqueued: 2018-12-21 03:58:04 +0000 UTC
    started: 2018-12-21 03:58:05 +0000 UTC
  unit: graylog/1
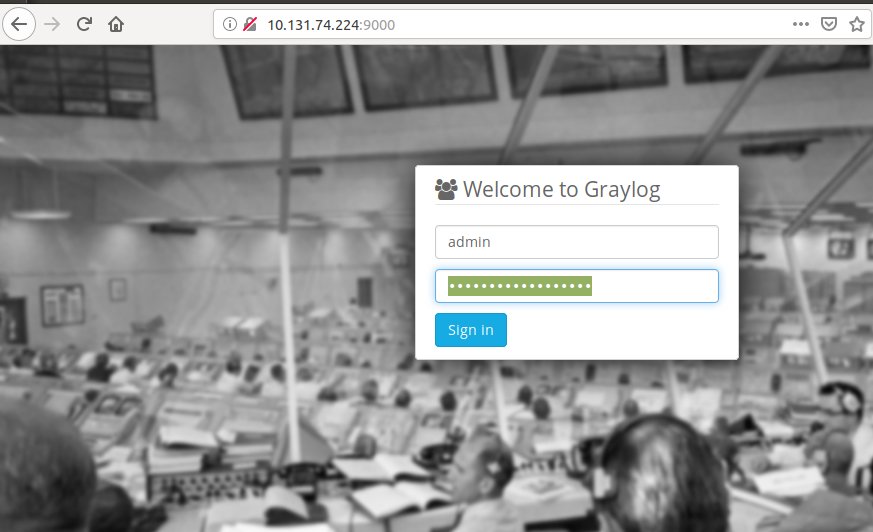
Now armed with the password and the IP of our graylog server go ahead and open a web browser to http://<ip_address>:9000. You should see something like this:
Switching gears a bit, we need to go setup Suricata. To do this, we’ll go ahead and launch a new lxd container using the Ubuntu and Filebeat charms, adding the Juju relations where necessary.
shaner@tp25:~$ juju deploy ubuntu
Located charm "cs:ubuntu-12".
Deploying charm "cs:ubuntu-12".
shaner@tp25:~$ juju deploy filebeat
Located charm "cs:filebeat-20".
Deploying charm "cs:filebeat-20".
shaner@tp25:~$ juju add-relation filebeat:beats-host ubuntu
shaner@tp25:~$ juju add-relation filebeat graylog
shaner@tp25:~$ juju config filebeat logpath=/var/log/suricata/eve.json
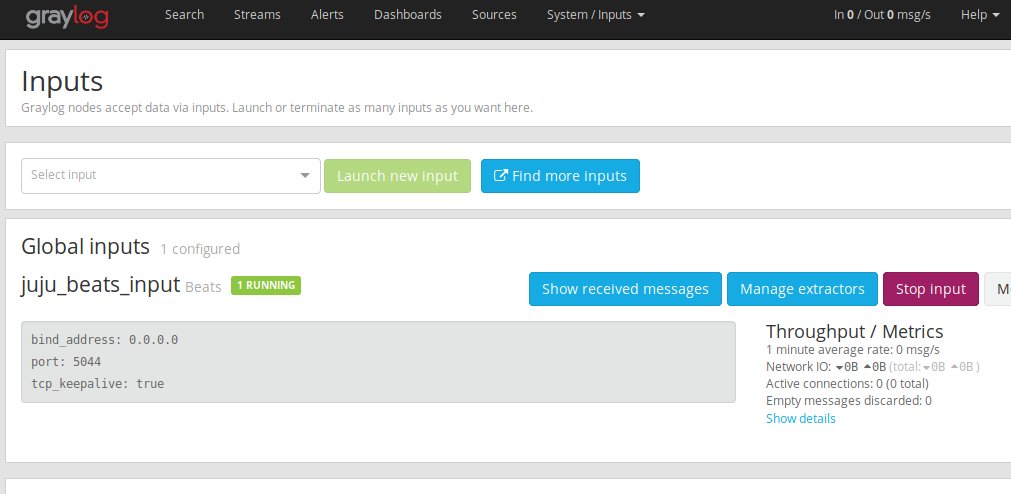
Using the power of Juju, filebeat will automatically configure a graylog Input and start sending our Suricata logs from /var/log/suricata/eve.json to it. We can see it did so here:
All that’s left now is to login to the container and setup Suricata.
shaner@tp25:~$ juju ssh ubuntu/0
ubuntu@juju-b43ea2-6:~$ apt-get install -y suricata filebeat
Because this is a demo and we’re in an unprivileged container, we’ll configure Suricata to use the good old pcap method for packet acquisition.
sed -i 's/LISTENMODE=nfqueue/LISTENMODE=pcap/g' /etc/default/suricata
Awesome, we’re ready to start things up.
root@juju-b43ea2-6:~# systemctl enable suricata filebeat
root@juju-b43ea2-6:~# systemctl start suricata filebeat
Go ahead and kick off an HTTP connection to generate some traffic for Suricata to see.
root@juju-b43ea2-3:~# curl -s https://www.google.com > /dev/null
If we did everything right, we should be able to switch back to the Graylog WebUI and click on ‘Search’ at the top and see some messages coming in.
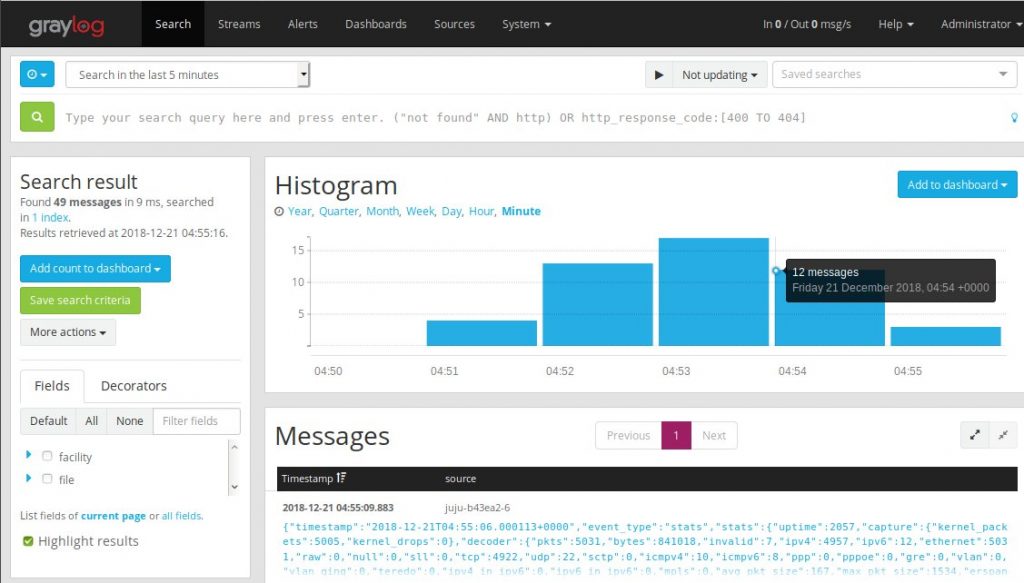
You’ll notice however, the message field is one big jumble of JSON text. We’ll want to configure extractors in order to map the JSON message string coming in from filebeat to actual fields in graylog.
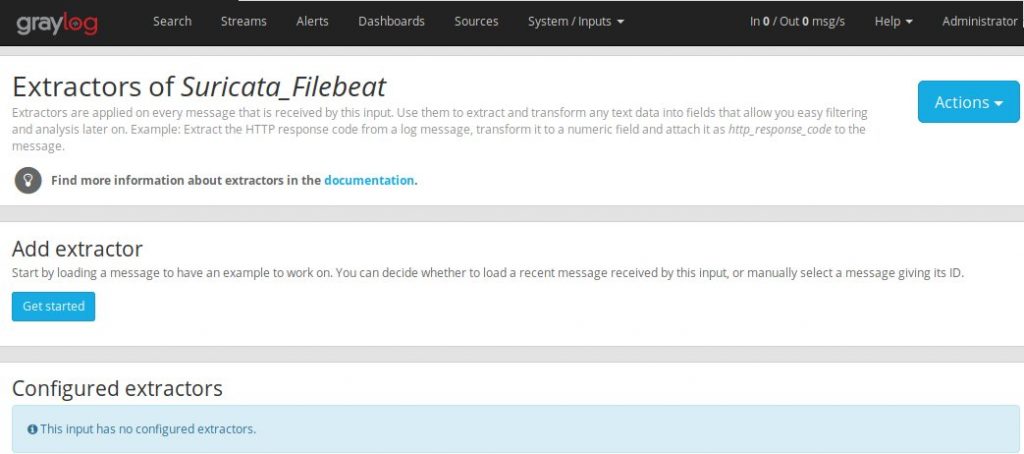
Go ahead navigate back to ‘System’->’Inputs’ and click on ‘Manage extractors’ for the input you just created. Then click on ‘Get Started’ button and load a message to work with.
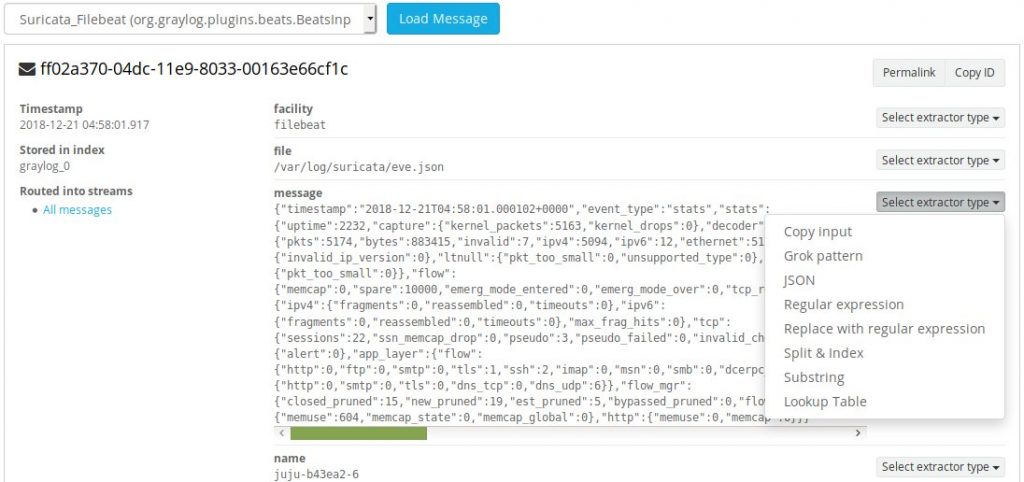
Once you load a message from the input, you’ll want to scroll down to the ‘message’ field and select a new JSON extractor.
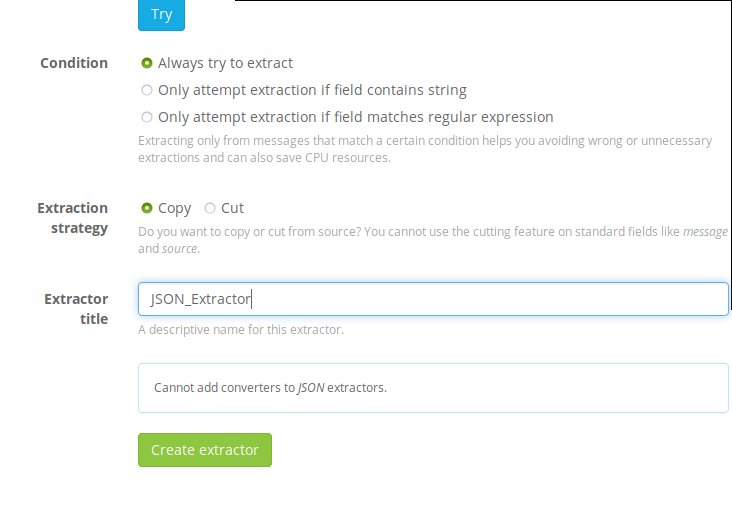
After you’ve clicked on ‘JSON’ from the drop down menu, scroll to the bottom of the page and after giving it a title, click ‘Create extractor’.
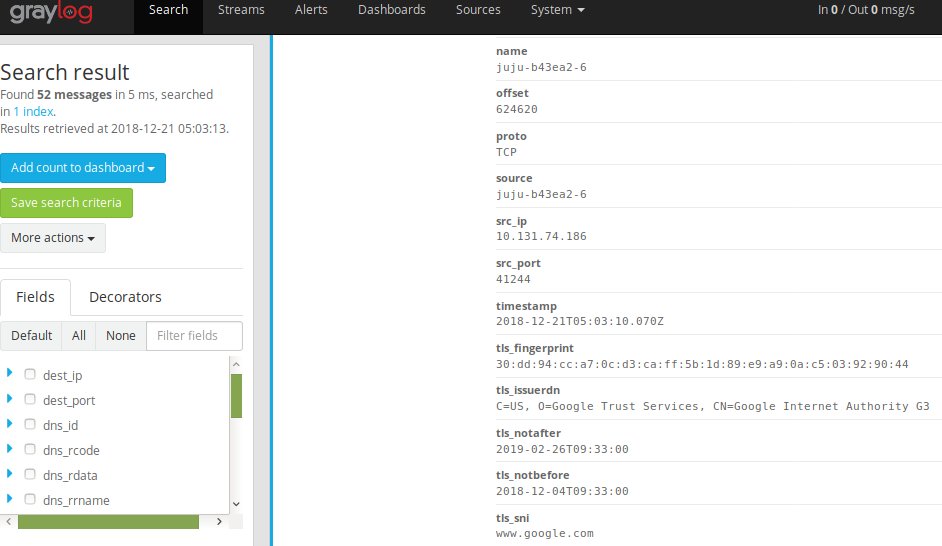
Switch back to you Ubuntu container and re-issue our curl command to generate some more traffic. Afterwards, switch back to graylog WebUI and go back to the Search dashboard. You should now see the the different JSON values being mapped to their respective fields.
In our next article, we’ll dive into setting up Streams, pipelines, and more.
Thanks for reading!

Leave a Reply
You must be logged in to post a comment.