Slow iSCSI performance on ZFS Volumes (zvol)

TL;DR: For reasons, don’t use ZVOLs for iSCSI volumes. Instead, just use a generic file.

I’ve been reorganizing my lab a bit to consolidate some storage and wanted to experiment with iSCSI. I thought “wow, what a great use-case for ZFS ZVOLS…”.

If you recall, ZFS has the ability to create block devices called ZVOLs. When you do this, you get a new device presented on the machine under /dev/zvol/<poolname>/ that you can use as you would any other disk. As part of my consolidation effort, I decided to use one and present it over iSCSI to my workstation. To my surprise, the performance was dismal, maxing out at around 30MB/s when writing to it over iSCSI.

Here are the steps I took to create the ZVOL and present over iSCSI. Note, I’m using FreeBSD as my storage server.

# zfs create -V 500gb zroot/luns/backup
# cat > /etc/ctl.conf <<EOF
portal-group pg0 {
	discovery-auth-group no-authentication
	listen 0.0.0.0
}
target iqn.2020-01.life.shaner:target0 {
	portal-group pg0
	lun 0 {
		path /dev/zvol/zroot/backup
		size 500G
	}
}
EOF
# sysrc ctld_enable=YES
# service ctld start
# ctladm lunlist
(7:1:0/0): <FREEBSD CTLDISK 0001> Fixed Direct Access SPC-5 SCSI device

With this in place, we can move to the (Linux) client machine (initiator in iSCSI parlance) and initiate a connection to the iSCSI drive then format it.

# iscsiadm --mode discovery -t sendtargets --portal 192.168.1.10
192.168.1.10:3260,-1 iqn.2020-01.life.shaner:target0

# iscsiadm --mode node --targetname  iqn.2020-01.life.shaner:target0 --portal 192.168.1.10 --login
Logging in to [iface: default, target: iqn.2020-01.life.shaner:target0, portal: 192.168.1.10,3260]
Login to [iface: default, target: iqn.2020-01.life.shaner:target0, portal: 192.168.1.10,3260] successful.

# dmesg |tail
[117514.525034] sd 9:0:0:0: Attached scsi generic sg5 type 0
[117514.525245] sd 9:0:0:0: Power-on or device reset occurred
[117514.527424] sd 9:0:0:0: [sdg] 1048576000 512-byte logical blocks: (537 GB/500 GiB)
[117514.527428] sd 9:0:0:0: [sdg] 131072-byte physical blocks
[117514.527706] sd 9:0:0:0: [sdg] Write Protect is off
[117514.527709] sd 9:0:0:0: [sdg] Mode Sense: 7f 00 10 08
[117514.528159] sd 9:0:0:0: [sdg] Write cache: enabled, read cache: enabled, supports DPO and FUA
[117514.528750] sd 9:0:0:0: [sdg] Optimal transfer size 8388608 bytes
[117514.675486] sd 9:0:0:0: [sdg] Attached SCSI disk

# mkfs.ntfs -Q /dev/sdg 

Let’s format it then mount it. Note this drive will eventually be mounted by a Windows machine thus we’re formatting it with NTFS.

# mkfs.ntfs -Q /dev/sdg
# mount -t ntfs3 /dev/sdg /mnt

At this point I proceeded to copy data onto the drive where it maxed out at 35MB/s. Abysmal. So, I decided to switch from ZVOL to a plain file on disk and use that instead.

# zfs destroy zroot/luns/backup
# zfs create -o mountpoint=/luns/backup zroot/luns/backup
# cd /luns/backup
# truncate -s 500G disk.img
# sed -i 's/\/dev\/zvol\/zroot/backup/\/luns\/backup\/disk.img/g' /etc/ctl.conf
# service ctld restart

After setting it up this way I was maxing out my 1Gb connnection with writes speeds of over 100MB/s, a 2x improvement in speed.

Lesson learned.

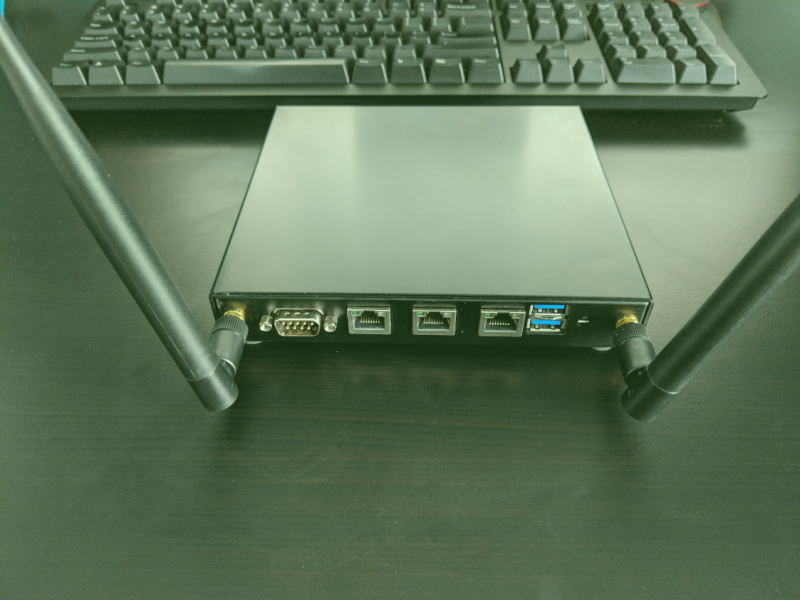
Adding WiFi Card to Alix apu Running pfSense

I always thought it would be neat to manage my home WiFi from the same interface as the rest of my network. After eyeing the hardware for a long time and doing some research every couple months or so, I finally made the leap and purchased the necessary hardware.

As I’m using an Alix apu2c2, some initial research showed that the WLE200NX coupled with a pair of 6dBi antennas was the way to go. 

After backing up my pfSense config (ALWAYS make a backup!) I shut it down and cracked it open to install the WiFi card.

This was mostly trivial, note that we use the third (mPCIe 1) slot for this. The first slot is for an mSATA drive.

All set, ready to power up and get it configured!

Head over to Interfaces -> Assignments then down to the Wireless tab. Click Add, select the detected device and set the mode to ‘Access Point‘. Then, click Save.

Head back to Interfaces -> Assignments and create a new interface, selecting new WiFi device.


Now, click on the newly created interface (OPT1, likely) and configure it like any other interface. Note, because it’s a wireless interface, you’re presented with a LOT more options as your scroll further down. Here’s, where you configure Channel, SSID, WPA2, etc…

Once you have everything configured, head over to Services -> DHCP Server and configure the DHCP server for your new interface.

Okay, just about done. All we have to do now is let traffic pass through the interface. To do so, head over to Firewall -> Rules and click your new WiFi interface. Below, you see I just added a quick ‘Allow All’ rule to make sure everything works as expected.

Testing this with both my phone and my laptop, I couldn’t be happier with the results!

Bhyve pfSense 2.4 no console menu

I ran into an annoying issue today while trying to install pfsense 2.4.2 in a bhyve VM using the ISO installer. Everything went swimmingly until post-install when pfsense finished startup and never provided the expected pfSense console. All it would show is bootup complete.

I went through and confirmed /etc/ttys was configured properly and added console=comconsole to /boot/loader.conf. However, it still wouldn’t work. I’d get all the typical startup info but it still wouldn’t drop to the pfSense console.

To fix this, I ended up having to install pfSense using the memstick serial installer.

In case you aren’t already using vm-bhyve, here’s how it went down from start to finish:

1. Install and initial setup:

pkg install -y vm-bhyve grub2-bhyve
zfs create -o mountpoint=/bhyve zroot/bhyve
sysrc vm_enable="YES"
sysrc vm_dir="zfs:zroot/bhyve"
vm init

I manage network bridges myself, so I’ll just import them into vm-bhyve so it can use them.

vm switch import wan bridge0
vm switch import mgmt bridge1
fetch -o /tmp/pf-memstick-serial.img.gz https://nyifiles.pfsense.org/mirror/downloads/pfSense-CE-memstick-serial-2.4.2-RELEASE-amd64.img.gz
gunzip /tmp/pf-memstick-serial.img.gz

2. Create pfsense VM:

cd /bhyve/.templates
cat > pfsense.conf <<EOF
loader="bhyveload"
cpu=2
memory=512M
network0type="virtio-net"
network0switch="wan"
network1type="virtio-net"
network1switch="mgmt"
disk0type="virtio-blk"
disk0name="disk0.img"
EOF
vm create -t pfsense -s20G pf1

3. Temporarily reconfigure the VM to use the memstick installer.
Basically, we just need to add another disk (the installer image) and make sure it’s first to boot.

cd /bhyve/pf1/
cp /tmp/
cp pf1.conf pf1.orig.conf
cat >pf1.conf<<EOF
loader="bhyveload"
cpu=2
memory=512M
network0_type="virtio-net"
network0_switch="wan"
network1_type="virtio-net"
network1_switch="mgmt"
disk0_type="virtio-blk"
disk0_name="/tmp/pf-memstick-serial.img"
disk1_type="virtio-blk"
disk1_name="disk0.img"
EOF
vm start pf1
vm console pf1

Walk through install process and when finished DON’T reboot. Simply disconnect from the console (~ + ctrl-d) and shut the vm down. If we let it reboot, it’ll just reboot back into the intaller since it’s still configured as the first disk.

vm stop pf1
mv /bhyve/pf1/pf1.orig.conf /bhyve/pf1/pf1.conf
vm start pf1

After it was all said and done, I checked what the memstick installer inserts into /boot/loader.conf to make it work. I’m guessing this is the key, and what I should’ve added to the loader config when I tried using the ISO installer initially.

boot_multicons="YES"
boot_serial="YES"
console="comconsole,vidconsole"
comconsole_speed="115200"

I didn’t try using the ISO installer and adding the above as I just wanted to get up and running, but it’d be interesting to see if it would do the trick.

Hope this helps some of you!

A security event pipeline using Bro, Kafka, and FreeBSD Jails

With the help of the Bro Kafka plug-in, we’ll configure Bro to stream JSON-formatted logs through Kafka and use python to subscribe and print events from the stream.

This tutorial uses FreeBSD 11.1-RELEASE. But can easily be adapted to Linux installations.

How do you monitor events from multiple Bro sensors throughout a network? Do you go to each one and search logs ad-hoc? Maybe fire up a tmux session with multiple synced panes and search them all at once?

With tools like filebeat (previously logstash-forwarder) we’ve been able to ship Bro logs off to remote systems without much effort for a number of years now. However, the way I see it, you’re left with two options.

1. Enable policy/tuning/json-logs.bro to produce JSON logs instead of the standard tab-delimited logs.

– No need to normalize/convert logs to JSON upstream.
– Easier to setup filebeat and tag with extra info.
– Can’t use bro-cut and other CLI tools to parse bro logs on the system.

2. Use the Kafka plug-in and ship logs through Apache Kafka.
– Logs are written to the host system as normal (tab-delimited), but are sent in JSON format to the specified Kafka topic(s).
– You can choose which logs are sent to Kafka (conn, dns, http, notice etc..)
– You can subscribe to a Kafka topic and receive logs from all sensors publishing to it as a single stream.
– You’ll need to manage a Kafka cluster.

Depending on your needs, both are decent options. However, for this tutorial, we’re going to setup and push logs into Kafka.

To start, we’ll want to get bro installed. Refer my previous tutorial on using Bro with Netmap to get up and running. Similar to compiling the netmap plug-in, we’ll need to compile the Kafka plug-in.

pkg install -y librdkafka
cd $BRO_SRC/aux/plugins/kafka
make && make install

The `make install` step isn’t needed if you’re building the plug-in for another system (matching FreeBSD version). You’ll find the compiled plug-in under $BRO_SRC/aux/plugins/kafka/build/BRO_KAFKA.tgz for this purpose.

Next, we’ll want to get Kafka up and runing. Here, we’ll use iocage to create a Kafka (+zookeeper) jail. Since Kafka runs on Java, we’ll want to have fdecfs and procfs available inside the jail as well. Replace ‘kafka’ in the last line here with whatever hostname you chose for your jail as Kafka will attempt to resolve it on start-up and generate an error if it’s unable to.

iocage create -r 11.1-RELEASE -n kafka ip4_addr="igb0|10.0.0.10/24" boot=on mount_fdescfs=1 mount_procfs=1
iocage console kafka
pkg install -y kafka zookeeper
echo "10.0.0.10  kafka" >> /etc/hosts

For development purposes, this will be the only node in the Kafka cluster so you shouldn’t need to change much. Go ahead and edit /usr/local/etc/kafka/server.properties and set the options below. Note, be sure to use whatever IP address you’ve configured for your jail:

delete.topic.enable=true
listeners=PLAINTEXT://10.0.0.10:9092
zookeeper.connect=10.0.0.10:2181

Now, lets enable all the things and fire up zookeeper and Kafka. There’s a small, first-time startup bug for kafka we’ll need to fix before starting Kafka. The init script attempts to chown a file that doesn’t exist (yet).

sysrc zookeeper_enable=YES
sysrc kafka_enable=YES
touch /var/log/kafka/kafkaServer.out
service zookeeper start; service kafka start

Make sure zookeeper and Kafka are running. Both 2181/tcp and 9092/tcp should be listening respectively. If they’re not, you can check the logs under /var/log/zookeeper and /var/log/kafka to see what’s going on.

root@kafka:~ # netstat -an | grep LISTEN
tcp4       0      0 172.16.0.68.9092       *.*                    LISTEN
tcp4       0      0 172.16.0.68.2181       *.*                    LISTEN

If everything looks good, go ahead and exit the jail, we’re done here for now.

Let’s tie the two together by configuring Bro to send logs to Kafka. Go ahead and log into your Bro system and add the following to local.bro file. On my system (installed from source) it’s located under /usr/local/bro/share/bro/site/.

root@kafka:~ # netstat -an | grep LISTEN
@load Bro/Kafka/logs-to-kafka.bro
redef Kafka::topic_name = "THREATLINE";
redef Kafka::tag_json = T;
redef Kafka::logs_to_send = set(Conn::LOG, DHCP::LOG, DNS::LOG, FTP::LOG, HTTP::LOG, SMTP::LOG, SSL::LOG, Notice::LOG, Software::LOG, Weird::LOG);
redef Kafka::kafka_conf = table(["metadata.broker.list"] = "10.0.0.10:9092");

From the above, you can see we’re sending the following logs to Kafka: conn, dhcp, dns, ftp, http, smtp, ssl, notice, software, and weird. There are a lot more logs available depending on which bro scripts you’ve enabled. Here, you’ll find more logs you can send. Be sure to use the IP address of the Kafka jail you created earlier in the above `metadata.broker.list` setting.

Have bro check our config before deploying it.

broctl check

If everything looks good, go ahead and deploy the new config. If you get any errors, double-check your config before running the next `deploy` command.

broctl deploy

Go ahead and generate some traffic for Bro to log. Bro will automatically create the topic if it doesn’t already exist.
Switch back to your Kafka system and run the below command to see if the topic you specified in the Bro config was created.

/usr/local/share/java/kafka/bin/kafka-topics.sh --list --zookeeper 172.16.0.68:2181
THREATLINE

If this doesn’t produce any output, the topic hasn’t been created yet and you’ll probably need to check that bro is running and logging traffic.

Alright, if you’ve made it this far you’re doing good. Let’s use a bit of python to connect to the Kafka topic and print the events to the screen.

First, we’ll install kafka-python While there are many python Kafka libraries out there now-a-days, this one seems to work pretty well. You can install using pip or your package manager.

pkg install py27-kafka-python
fetch https://gist.githubusercontent.com/shanerman/746f79771702bd2ff0a9eb23de0343d3/raw/43437b2b0cb319d755d036eb33e037fe5b1dfeab/print_bro_stream.py
python2.7 print_bro_stream.py

At this point, logs should start printing to your screen. If you’re not seeing anything, you may have to (again) generate some traffic for Bro to log.

Ok, so we have all our Bro sensors pushing various log data into a unified stream of events ready for consumption. Now what? Well the sky is the limit at this point. Here are a few ideas
– Have logstash subscribe to the Kafka topic and push events into Elasticsearch.
– Monitor `dns` events, check for evil domain names.
– Watch the `conn` events and look for compromised IP addresses.
– Watch `software` events and get an idea what software is running on your network.
– Monitor `ssl` events for bad SSL Certificates.
– etc…

Once you have a the Bro event in a python data structure, the sky really is the limit. In future posts, we’ll dive deeper into processing these events using python and do some alerting.

Bro on FreeBSD Using Netmap

NETMAP is a framework for very fast packet I/O from userspace with support for FreeBSD, Linux, and even Windows. Here, we’ll show how to set Bro up to use it.

Bro provides support for monitoring interfaces using netmap. However, as of FreeBSD 11.1 (bro-2.5.1) the binary package doesn’t ship with the needed netmap plugin. Furthermore, the port doesn’t support building any auxiliary plugins. Not to worry, we’ll just install Bro from source. It’s painless, trust me. 🙂

Setup used:
– FreeBSD 11.1-RELEASE
– NIC – Intel (igb driver)

1. First, we’ll need to install the necessary dependencies for compiling bro.

pkg install -y bash git flex bison cmake libpcap python py27-sqlite3 caf swig30`

2. Download the source tarball and extract it.

mkdir /usr/local/src && cd /usr/local/src
fetch https://www.bro.org/downloads/bro-2.5.2.tar.gz
tar xzf bro-2.5.2.tar.gz && rm bro-2.5.2.tar.gz
cd bro-2.5.2

2. Let’s compile bro. Note, if you just need the plugin (for another system with a binary install using pkg), don’t run `make install`. Instead, after performing the build, just grab `./build/dist/Bro_Netmap-0.1.tar.gz` and copy/extract it where you need (with similiar FreeBSD version). Otherwise, proceed with the typical configure, make, and make install.

./configure && make -j2 && make install

3. Now we can compile and install the netmap plugin.

cd aux/plugins/netmap
./configure && make && make install

4. Now, we just need to configure bro to use netmap. Here, we’re instructing bro to create 4 load balancer processes for monitoring the the igb1 interface.

cat >/usr/local/bro/etc/node.cfg <<EOF
[logger]
type=logger
host=localhost
[manager]
type=manager
host=localhost
[proxy-1]
type=proxy
host=localhost
[worker-1]
type=worker
host=localhost
lb_method=custom
lb_procs=4
interface=netmap::igb1

If the interface you’re having Bro monitor is dedicated to Bro and nothing else, enable `promisc` on the interface. Just edit /etc/rc.conf:

ifconfig_igb3="promisc mtu 9000 up"

5. This is all well and good, however packets won’t be balanced across your four `lb_procs` without the help of a utility called `lb`. There’s currently no port for `lb` and you won’t find it with other netmap utilities shipped under `/usr/src/tools/tools/netmap`. We’ll have to compile it manually.

cd /usr/local/src
fetch https://github.com/luigirizzo/netmap/archive/master.zip
unzip master.zip && rm master.zip
cd netmap-master/apps/lb
pkg install gmake
gmake
cp lb /usr/local/bin/
rehash

Now, lets start `lb` in the background and fire up Bro.
Make sure to create the same amount of pipes (`-p`) as `lb_procs` from the Bro config.

lb -i igb1 -p 4&
/usr/local/bro/bin/broctl deploy
cd /usr/local/bro/logs/current

You should now see some logs start to roll in.

6. Okay now, let’s create some init scripts so both `lb` and `bro` start at boot time.

fetch -o /usr/local/etc/rc.d/bro https://gist.githubusercontent.com/shanerman/3988b535e9b7d1ee92afd88e47ba50da/raw/2a3e3feec2a3b9734013736e4dc43513608a9afd/bro
fetch -o /usr/local/etc/rc.d/lb https://gist.githubusercontent.com/shanerman/0efe1f5c4b5c7ab083f274a3d9c14543/raw/acdb2e7d6ae3d0599a0783006de9dd8cc3672d31/lb
chmod 555 /usr/local/etc/rc.d/{lb,bro}

That’s all folks. If you have any questions or tips, you can email me at shaner@shaner.life

Install Bro on pfSense

I’ve been working with Bro a lot lately and thought it’d be worth trying to get Bro running on pfSense. In an ideal situation, you wouldn’t normally run an IDS on your firewall, but for low bandwidth installations or the budget constrained, it’ll work fine.

1. You’ll need to enable ssh access to your pfSense firewall as it’s not enabled by default. To do this, login to pfsense and browse to System > Advanced, then scroll down to the SSH section and check ‘Enable Secure Shell’.

I recommend setting up pub key authentication by adding your public key to the admin user in pfsense. This will allow you to login via ssh without using a password. Just don’t lose your private key!

2. Now open a terminal and ssh into pfsense. Note, we’re using the ‘root’ user instead of the normal ‘admin’ you typically use to login via web interface.

ssh root@192.168.1.1

You’ll then be presented with a text interface. You’ll want to drop to a shell which is option ‘8’.

3. By default, pfSense disables upstream pkg repositories (for good reason). So lets re-enable them albeit, temporarily. There are two files you’ll need to edit.

/usr/local/etc/pkg/repos/FreeBSD.conf
/usr/local/share/pfSense/pkg/repos/pfSense-repo.conf

Make it look like:

FreeBSD: { enabled: yes }

4. Now, we can update the pkg cache and get on with installing and configuring bro.

pkg update && pkg install -y bro

5. Bro should now be installed. **You should now reverse the changes you made in step 3.** You’ll need to pick which interface you’d like Bro to monitor. I’m going to monitor my (LAN) interface which equates to ‘igb1’ for my Intel NIC.

cat > /usr/local/etc/node.cfg <<EOF
[logger]
type=logger
host=localhost
[manager]
type=manager
host=localhost
[proxy-1]
type=proxy
host=localhost
[worker-1]
type=worker
host=localhost
interface=igb1
EOF

6. Next, we’ll disable status emails, and have bro rotate logs once a day instead of the default one hour.

cat > /usr/local/etc/broctl.cfg <<EOF
MailTo = root@localhost
MailConnectionSummary = 0
MinDiskSpace = 0
MailHostUpDown = 0
LogRotationInterval = 86400
LogExpireInterval = 0
StatsLogEnable = 1
StatsLogExpireInterval = 1
StatusCmdShowAll = 0
CrashExpireInterval = 1
SitePolicyScripts = local.bro
LogDir = /usr/local/logs
SpoolDir = /usr/local/spool
CfgDir = /usr/local/etc
EOF

7. Have bro check your configuration and start it up. While the ‘deploy’ command will automatically run ‘check’ for you, it’s good practice to run it by itself after any modifications to Bro before deploying those changes.

broctl check && broctl deploy

8. You should now be able to watch the logs Bro is generating.

tail -f /usr/local/logs/current/*

So there you have it, bro running on pfSense. In upcoming articles, I’ll dive into parsing bro logs using `bro-cut` and also how to setup Bro to push logs into an Apache Kafka pipeline for more fun and profit.